Showing posts with label charts. Show all posts
Showing posts with label charts. Show all posts
11/6/11
3/7/11
3/5/11
2/24/11
12/16/10
Charts Of The Day
Unicef issued a report (pdf) that pretty much shows that the U.S. is failing its most vulnerable, and that is why education is in the privateers' sights.


11/7/10
We've Sure Killed A Lot Of Civilians
Kamel Makhloufi
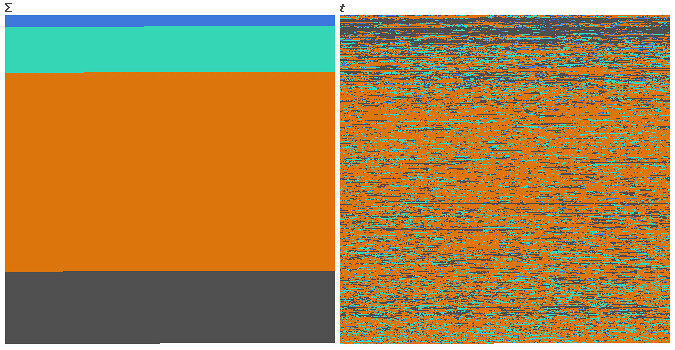
Blue = *Friendly*, Green = *Host* Nation, Orange = Civilians, Grey = Enemies.
First one is function of sum, second one is function of time, or how you can dilute the media impact of a massacre by killing a few people each day for 6 years. Just remember that host nation + civilian + enemies = mostly Iraqis.
Used the cleaned dump from The Guardian.
10/16/10
12/3/09
Subscribe to:
Posts (Atom)


